At a glance
Improve car wash profitability by measuring completed services, actual revenue and operating costs, then testing specific changes to staffing, service mix and resource use. Validated vehicle counts can provide demand context, but cannot establish profit or paid washes. AI is useful when it reduces a measured information gap at a reasonable cost. Start with reliable records and a baseline rather than assuming more technology or more gate traffic will create margin.
Define the metrics before building a dashboard
Begin with a service register and transaction records. Completed jobs measure delivered work; net service revenue measures sales after the adjustments included in your definition. Cash collected can differ from sales because of fleet credit, deposits and refunds. Contribution is revenue less the variable costs of delivering those services. Operating profit then accounts for the remaining business costs under your chosen accounting treatment. Ask your bookkeeper to keep these definitions consistent.
Gate entries describe movements, not sales. To estimate wash conversion, first establish eligible service visits through an agreed record process. Exclude suppliers, staff movements and other non-customer access where the definition requires it, and avoid counting repeat boundary crossings as new prospects. Completed washes divided by eligible visits can support a conversion discussion, but only when the period and records align. If they do not, report the two totals separately.
Build a baseline that reflects Kenyan operating conditions
Record several comparable operating periods before changing the business. Include opening hours, completed services by category, revenue, staffing hours, resource purchases and downtime. Note rain, unusual water availability, public holidays, nearby roadworks and fleet bookings. These notes help distinguish a change in demand from a change in operations. They do not require invented national market statistics or a claim that every Kenyan car wash has the same trading pattern.
A Nairobi roadside wash, a petrol-station service and a booked detailing business face different traffic and service mixes. Compare your own like-for-like periods before borrowing targets from another site. If camera counting becomes available, validate coverage and retain the same boundary rules throughout the comparison. A moved camera or newly monitored gate can change the apparent traffic without any change in the underlying business.
Measure average ticket and service mix using actual jobs
Average ticket is defined here as net service revenue divided by paid completed jobs in the same reporting cohort. Keep complimentary work, fleet credit and bundled services explicit so the ratio remains interpretable. An increase in average ticket may reflect more detailing work rather than a price improvement. Track service categories and their delivery effort alongside the headline number. A higher selling price is not necessarily a higher contribution if the job consumes substantially more labour and materials.
For an explicitly illustrative example, suppose 30 paid jobs produce KES 15,000 in net service revenue. The average ticket is KES 500 under that definition. This is arithmetic using invented inputs, not a Kenyan market price or CraftDuka result. Review your actual records before deciding whether a different package, a clearer menu or better quotation handling could improve the mix without creating unsuitable work or unnecessary customer pressure.
Use arrival patterns to test workforce scheduling
Hourly traffic can highlight when to observe queues and enquiry handling. Pair it with service start and completion times, available bays and staff roles. A long interval between entrance and exit is not automatically wash time: a vehicle might wait, park or receive several services. Measure the specific interval you want to improve through job records or a separate validated workflow rather than giving a gate count more meaning than it contains.
Trial a schedule change for comparable periods and check waiting time, completed jobs, rework and paid hours. Include breaks, equipment preparation and safety needs. A plan that reduces labour on paper but creates long queues or rushed cleaning can reduce contribution and repeat business. Discuss the change with staff, document exceptions and avoid using entrance totals to rank individual workers who may be doing very different tasks.
Track water, chemicals and equipment costs per service
Measure what you can control. Log water meter readings or another appropriate source record, chemical quantities issued, equipment downtime and maintenance spend. Compare consumption with completed services and the service mix. A detailing-heavy day may use different materials from a day of basic exterior washes. Purchased supplies are not always consumed immediately, so inventory movements matter when converting purchase records into service costs.
Investigate unusual consumption with practical checks: leaks, dilution procedures, rewash frequency, equipment condition and recording mistakes. Trial one change at a time where feasible and protect cleaning quality and staff safety. A camera does not directly measure litres or chemical use; those figures need meters, stock records or other appropriate inputs. Future software can organise these records, but should never imply that visual vehicle counting verifies resource efficiency.
Evaluate pricing through contribution and customer response
Build a service cost view using actual materials, delivery effort and overhead treatment. Compare quoted prices with accepted jobs and recorded reasons for declining, where customers volunteer them. A shared-access gate count cannot tell you why a person did not buy. Review clarity of the menu, turnaround expectations and quality before assuming that a lower price is the only way to improve conversion.
When testing a price or package change, define the period, service category and comparison basis in advance. Check contribution per completed job, total contribution, waiting time and repeat complaints. Do not celebrate a higher daily sales total if discounts or delivery costs consume the gain. For fleet customers, account for payment timing and collection effort as well as invoice value. Keep illustrative planning calculations separate from verified bookkeeping results.
Calculate monitoring ROI with conservative, explicit assumptions
Define the one-time investment and monthly running costs. Then identify incremental benefits that can reasonably be attributed to the change, such as measured reporting time saved or additional contribution from jobs a tested schedule change enabled. Do not count all existing revenue as a benefit, assume that every unexplained entry is a lost sale or treat a suspected loss as proven. Avoid counting the same staff time saving twice under different labels.
Illustrative planning example only: assume a one-time cost of KES 60,000, monthly running costs of KES 4,000, verified monthly cash savings of KES 3,000 from reduced reporting overtime and additional contribution of KES 5,000. Net monthly benefit is KES 4,000, giving a simple payback of 15 months. These invented figures are not CraftDuka prices or forecast outcomes. If incremental contribution is zero, the monthly result becomes negative KES 1,000, so there is no positive simple payback.
Simple payback omits financing, tax, depreciation and the time value of money. Use it as an initial comparison, then review the actual cash-flow implications with your finance adviser. Run a low-benefit and high-cost scenario, including maintenance and downtime. Monitoring should justify its own cost against the decisions it improves, rather than relying on an AI label or an unsupported claim of guaranteed revenue growth.
Follow a staged measurement plan before scaling
First agree definitions and establish the baseline using existing records. Next identify the largest uncertainty: traffic timing, service completion, pricing, resource use or payment matching. Choose one intervention that addresses that uncertainty. If it is vehicle counting, validate one entrance and keep manual observations alongside it. If the problem is incomplete service records, improve that process before buying more camera hardware.
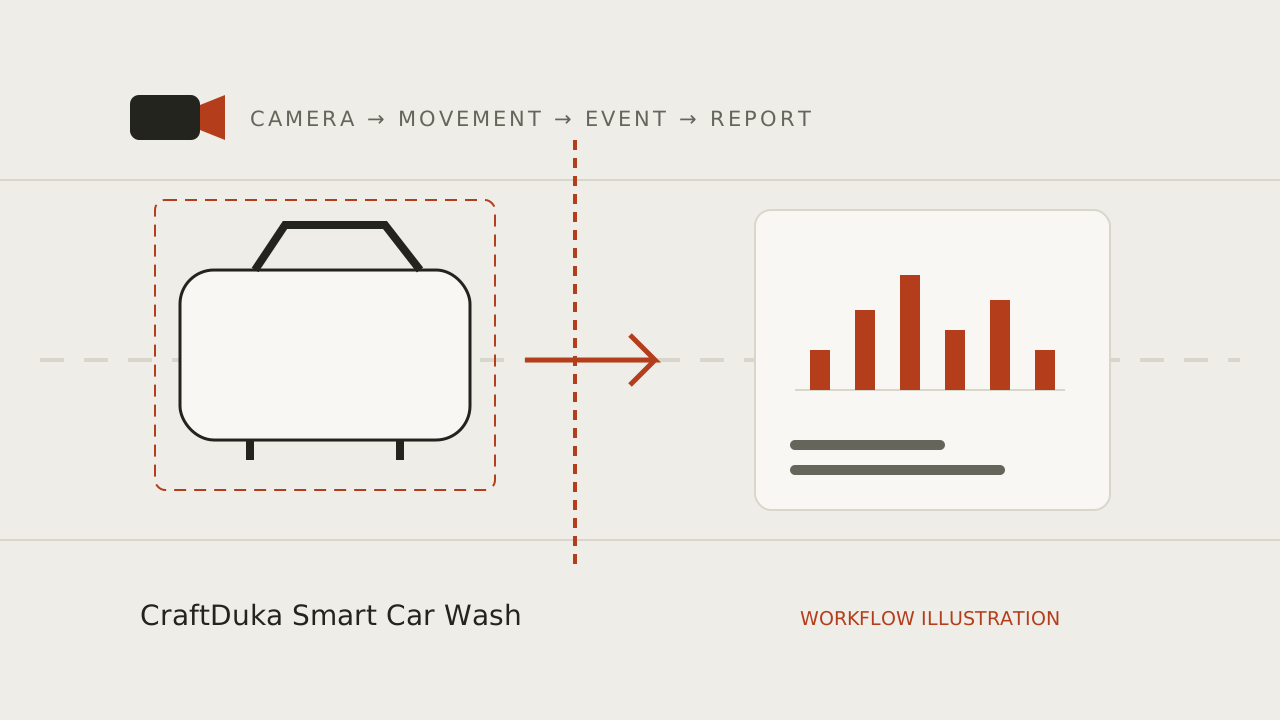
Review the intervention over comparable periods and write down what improved, what remained unknown and what it cost to operate. Expand only when the information supports a repeatable decision. CraftDuka’s Smart Car Wash currently has a camera-to-WhatsApp image proof of concept; automated counts, dashboards and POS integrations require further development, scoping and validation. A consultation can assess whether a pilot addresses your specific information gap without promising a profit increase.
- Record actual jobs, payments, costs and operating conditions.
- Choose one operational question and one measurable change.
- Check coverage, exceptions and customer experience alongside financial results.
- Recalculate the business case with observed benefits before expanding.
Plan your monitoring workflow
Explore CraftDuka Smart Car Wash and its current pilot scope. Continue with these related guides:
- AI Car Wash Monitoring in Kenya: How Smart Cameras Are Changing Car Wash Management
Understand AI vehicle counting for Kenyan car washes: camera requirements, WhatsApp reports, practical limits, privacy and a responsible pilot checklist.
- How to Automatically Count Cars Entering a Car Wash Using AI Cameras
A practical guide to entrance camera placement, vehicle detection and tracking, virtual counting lines, duplicate prevention and manual accuracy checks.
- How Car Wash Owners Can Improve Accountability Without Micromanaging Employees
Build fair car wash accountability with shift records, service logs and traffic reconciliation. Understand exceptions and protect staff privacy.
Key takeaways
- Profit needs actual income and cost records; gate traffic is a separate demand signal.
- Define conversion using eligible service visits, not every vehicle movement.
- Evaluate pricing and staffing changes against contribution and customer experience.
- Use conservative incremental benefits in ROI calculations and include recurring costs.
Frequently asked questions
Can I calculate revenue by multiplying entries by my wash price?
That is only a hypothetical scenario, not verified revenue. Entries include non-buyers and repeat movements, while service prices and payment timing vary. Use service and transaction records to report actual revenue and label any planning estimate clearly.
What should a small owner measure first?
Begin with completed services by category, actual payments or sales under a clear definition, paid staff hours and significant resource costs. Add traffic timing if it addresses a specific decision. A few reliable records are more useful than a dashboard containing many uncertain metrics.
Will AI automatically make my car wash more profitable?
No. It may supply information or reduce effort, but benefits depend on reliable inputs, sensible operating changes and total costs. Validate the workflow and evaluate the resulting decisions. CraftDuka does not promise a revenue increase, a universal ROI or a fixed payback period.